QUERY EDITOR
1. ANALYTICAL QUERY 1 : Querying the DynamoDB price_float field
In the first analytical query, you’ll perform aggregations to find the average price of cars purchased. You already performed a SQL-based transformation at ingestion that converted the original field from a STRING type to a FLOAT type.
In the query editor, copy and paste the query below to the Rockset Query Editor and Run it:
'SELECT AVG(c.price_float) as avgprice FROM commons.CarPurchases as c'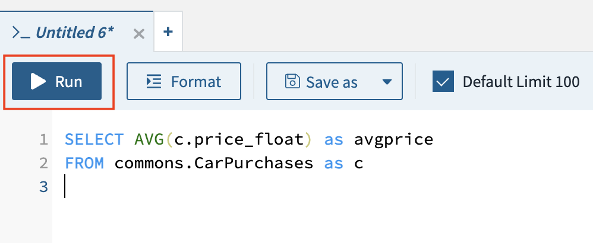
Grafana requires time-series data. As such, we’re going to modify our query to aggregate the average car purchases by the minute. We’re also going to create 2 parameters to see purchases between 2 particular time periods.
Copy and paste the query below into the Query Editor. Do not Run it:
        SELECT TIME_BUCKET(MINUTES(1), c._event_time) as timen, AVG(c.price_float) as avgprice,
        FROM commons.CarPurchases as c
        WHERE c._event_time > :startTime AND c._event_time < :stopTime
        GROUP BY timen
        ORDER BY timen
To create a parameter, click on the Parameters tab and Add Parameter:

Name the parameter startTime, set the type as timestamp, and format the value like this: YYYY-MM-DDT00:00:00. Use today’s date. If you’re attending the live workshop, enter this:
2022-03-30T00:00:00.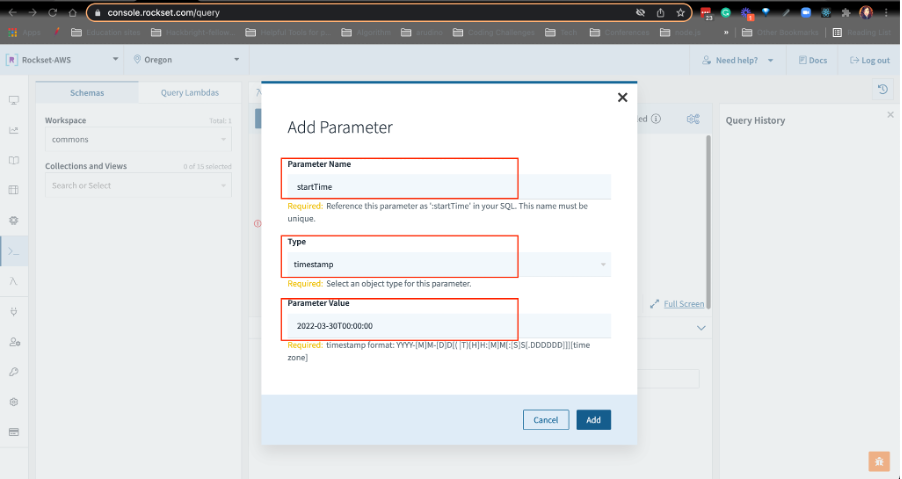
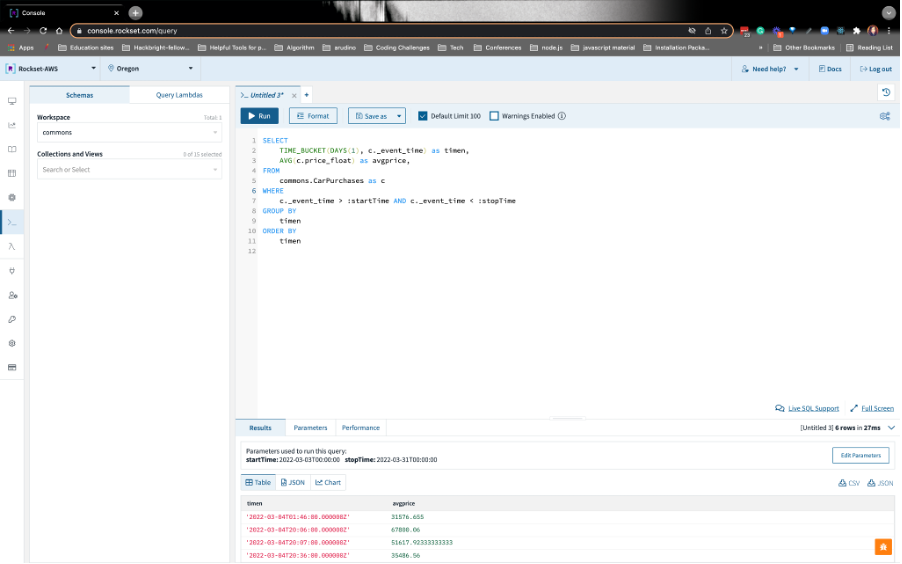
Please repeat this step for stopTime. Use timestamp as the data type and set the value to 1 week after startTime, e.g.,
2022-04-06T00:00:00.Now, Run the query. You should see something like this:
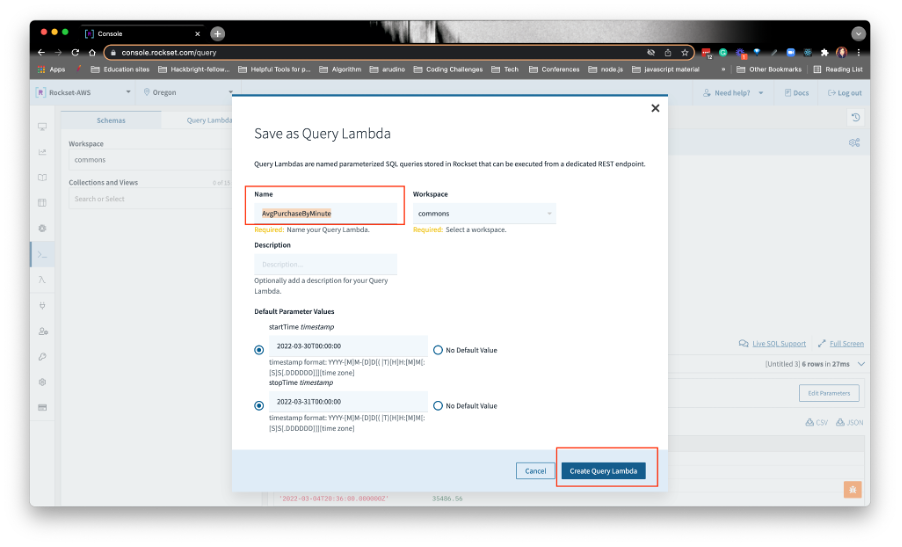
2. SAVE ANALYTICAL QUERY 1 AS A QUERY LAMBDA
Create a RESTful API endpoint for your query. These are called Query Lambdas. Click on Save as from the drop-down menu and choose Save as a Query Lambda. Name the Query Lambda AvgPurchaseByMinute and click on Create Query Lambda:
The query lambda is how you’ll save your queries. If you need to reference a query later, you can look them up by clicking on Query Lambdas in the left nav.
3. ANALYTICAL QUERY 2: Joining DynamoDB and S3 data
We’ll write the second query to see which companies sold the most cars. The car transactional data contains the company_id. We’ll join this field with the company_id contained in the car company information stored in S3. From there, we’ll be able to associate the car companies who sold the most cars.
Open a new Query Editor tab:
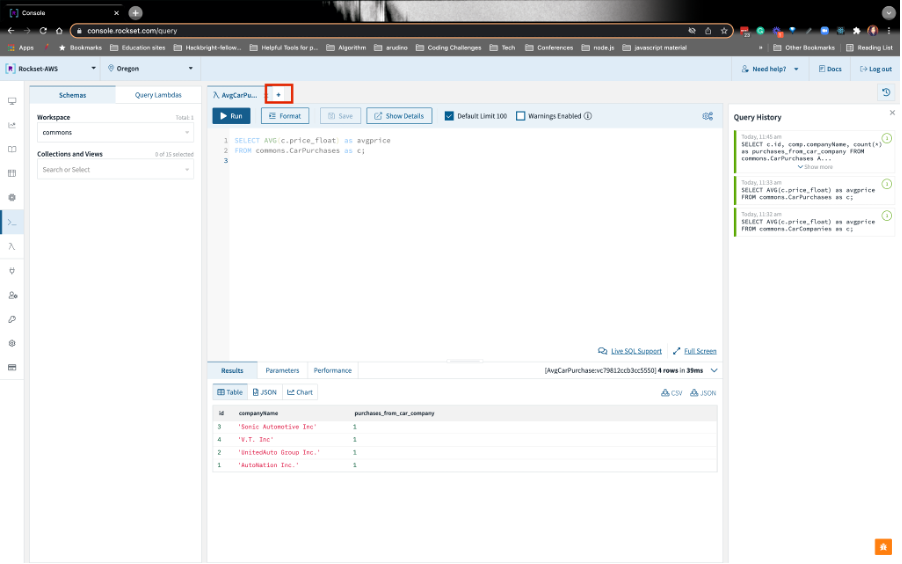
Paste this this query below, highlight the query, and run it:
SELECT c.id, comp.companyName, count(*) as
purchases_from_car_company
FROM commons.CarPurchases AS c
JOIN commons.CarCompanies AS comp ON c.id =
TRY_CAST(comp.companyId AS int)
GROUP BY comp.companyName, c.id
ORDER BY count(*) DESC;
Grafana requires time-series data, so we’ll modify this query like we did for Analytical Query #1. Just paste this query below in the Rockset Query Editor. Do not Run it yet:
   SELECT
       comp.companyName,
       count(*) as purchases_from_car_company,
   TIME_BUCKET(minutes(1), c._event_time) as timen
   FROM
       commons.CarPurchases AS c
   JOIN commons.CarCompanies AS comp ON c.id = try_Cast(comp.companyId AS int)
   WHERE
   c._event_time > :startTime AND c._event_time < :stopTime
   GROUP BY
       comp.companyName,
       timen
   ORDER BY
       count(*) DESC
   ;
Create 2 parameters, startTime and stopTime like you did in Analytical Query #1. The data type will be timestamp. The value for startTime will be today’s date and the value for stopTime will be next week’s date, e.g.
2022-03-30T00:00:00and2022-04-06T00:00:00, respectively.
4. Save Analytical Query 2 As a Query Lambda
Create a Query Lambda like you did with Analytical Query #1. You can save it as CompanySoldCarsByMinute:

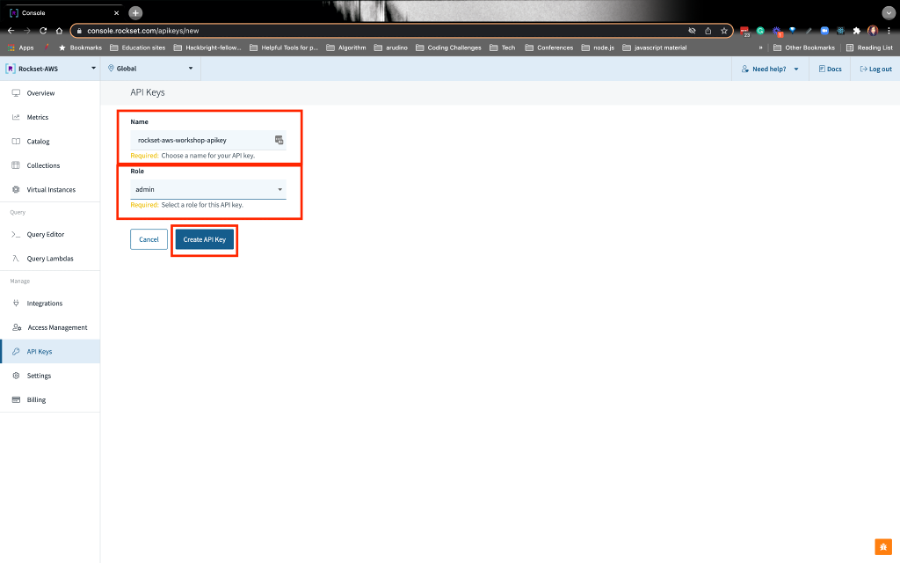
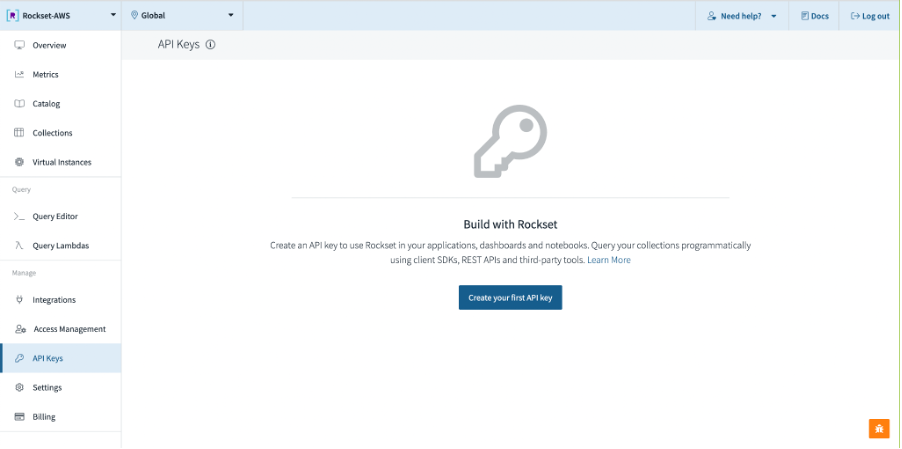
5. CREATE A ROCKSET API KEY
Navigate to the API Keys section in the left nav and click on Create your first API Key:
Name your key rockset-aws-workshop-apikey. Make sure you choose the admin role. Finally, click on Create API Key on the bottom: